Specialized Masters
Customize your graduate business learning experience to your career goals, with 1-year to 18-month programs in business analytics, finance, marketing, innovation, social entrepreneurship, global supply chain management and more.
Specialized Masters
Specialized Masters
Customize your graduate business learning experience to your career goals, with 1-year to 18-month programs in business analytics, finance, marketing, innovation, social entrepreneurship, global supply chain management and more.
PROGRAMS
MS Business Analytics (MSBA)
MS Entrepreneurship + Innovation (MSEI)
MS Finance (MSF)
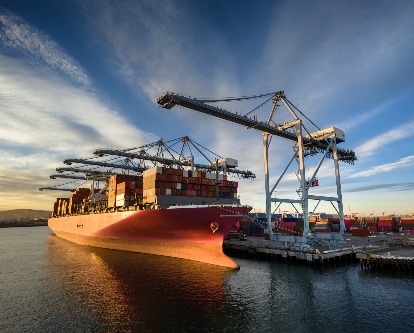
MS Global Supply Chain Management (MSGSCM)
MS Marketing (MSMKT)
MS Social Entrepreneurship (MSSE)
Master of Business for Veterans (MBV)
Master of Management Studies (MMS)
The Master of Management Studies (MMS) program is designed to provide those who have already completed the equivalent of at least one year of an accredited MBA program with an opportunity to pursue further elective study.
PROGRAM LEARNING GOALS
NEWS + EVENTS
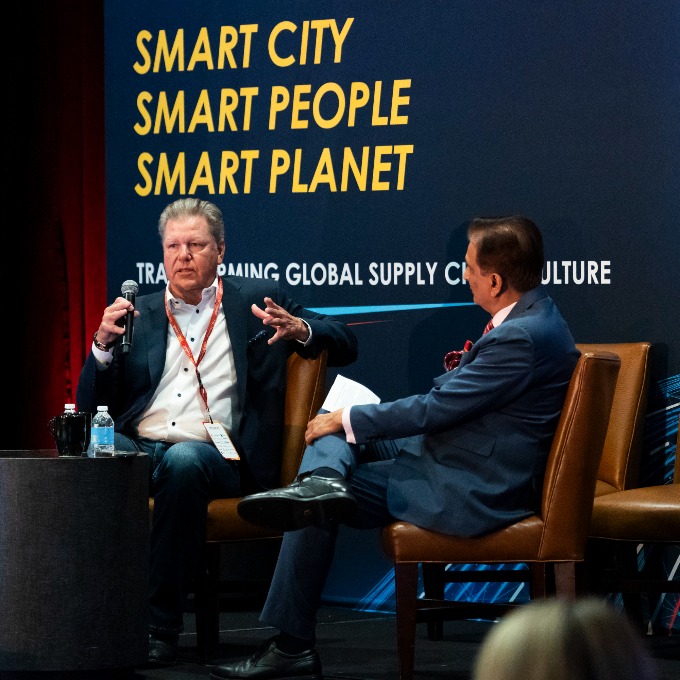
2025 Global Supply Chain Summits Tackles Global Trade Uncertainty and AI Transformation
Industry leaders, students, and USC Marshall faculty gathered for a two-day conference on the resilience of supply chains in the midst of a shifting international landscape.
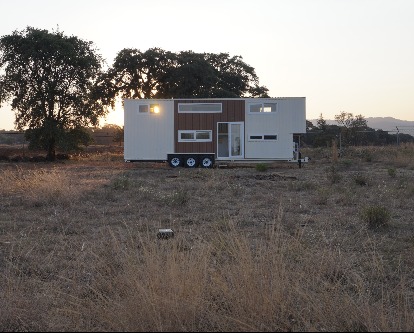
USC Marshall Alumna’s Tiny Homes Bridge Gaps in Affordable Family Housing
Rebecca Borough ’16 takes lessons from the MSSE program to Tiny Topanga.
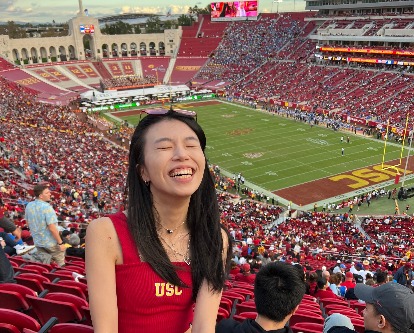
From Taiwan to Los Angeles, Social Entrepreneurship Student Builds Legacy at USC Marshall
Recent graduate Rikke Yeh moves beyond the familiar to foster growth, innovation.
Imperfectly Perfect Plushies, Low Carbon Concrete Win Top Prizes at New Venture Seed Competition
Greif Center gives away $160K to USC-affiliated startups at its largest entrepreneurship competition of the year.
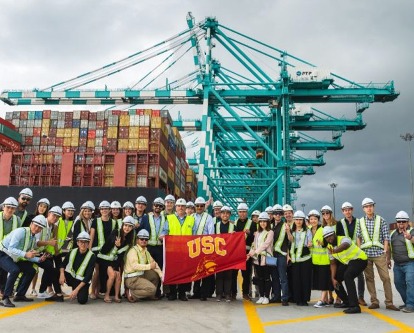
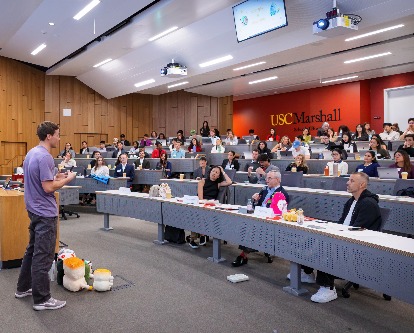
USC Marshall’s Global Supply Chain Management Program Prepares the Next Generation of Leaders
Graduates harness advanced technologies to create resilient, agile, and sustainable supply chains that benefit business and society.